Slime Squisher
Posts: 330
Joined: Thursday, 10th May 2012, 03:29
![]() Wednesday, 1st February 2017, 07:08
Wednesday, 1st February 2017, 07:08
DCSS Data Analysis by dude on reddit
Check it out! https://colinmorris.github.io/blog/dcss_species
Incedentally, Sequell could make similar graphs by making a query with the ' -graph' flag, e.g.,
Produces this graph (I can't remember how to sort by something else)
Which captures similar information (but not limited to cao games) as the OP's graph:
Some of his visualizations are very cool, and if you're interested in learning about data analysis/visualization using the Python libraries numpy/pandas/matplotlib it's definitely worth taking a look.
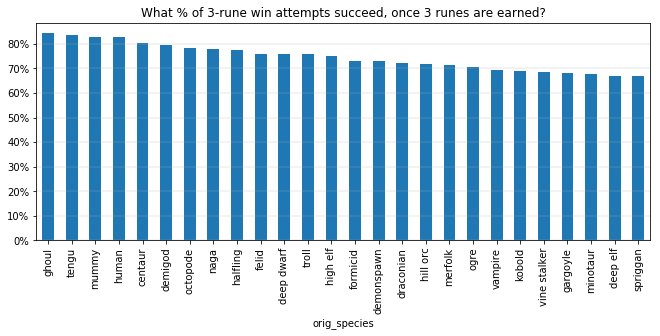
There's a cool table lower on the page which ranks species by winrate given they've reached certain milestones (temple, lair, vaults, zot).
A disproportionately small pink bar (like the one on trolls), suggests that this species has a strong early game. Getting to the temple doesn't much increase their chance of winning, because they were expecting to make it to the temple. A large pink bar (e.g. ghoul, naga), suggests that going from D:1 to the temple is a significant filter for this species.[/quote]
Links: r/roguelikes thread
r/dcss thread <- Check this out for some commentary by some devs
Incedentally, Sequell could make similar graphs by making a query with the ' -graph' flag, e.g.,
Produces this graph (I can't remember how to sort by something else)
Which captures similar information (but not limited to cao games) as the OP's graph:
Some of his visualizations are very cool, and if you're interested in learning about data analysis/visualization using the Python libraries numpy/pandas/matplotlib it's definitely worth taking a look.
There's a cool table lower on the page which ranks species by winrate given they've reached certain milestones (temple, lair, vaults, zot).
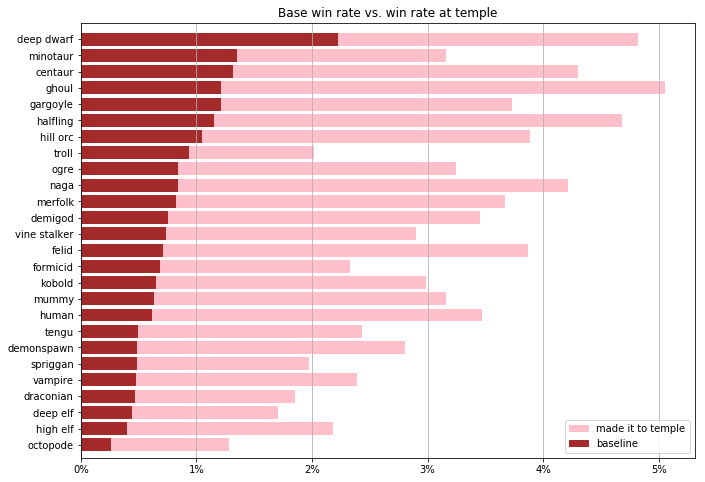
colin_morris wrote:The brown bars here are our familiar win-rates from before, but the pink bars are new: they show what % of games each species wins given that it reaches the ecumenical temple.
A disproportionately small pink bar (like the one on trolls), suggests that this species has a strong early game. Getting to the temple doesn't much increase their chance of winning, because they were expecting to make it to the temple. A large pink bar (e.g. ghoul, naga), suggests that going from D:1 to the temple is a significant filter for this species.[/quote]
Links: r/roguelikes thread
r/dcss thread <- Check this out for some commentary by some devs
Last edited by n1000 on Saturday, 4th February 2017, 00:54, edited 1 time in total.


